Descripción
ENVIAR EMAIL
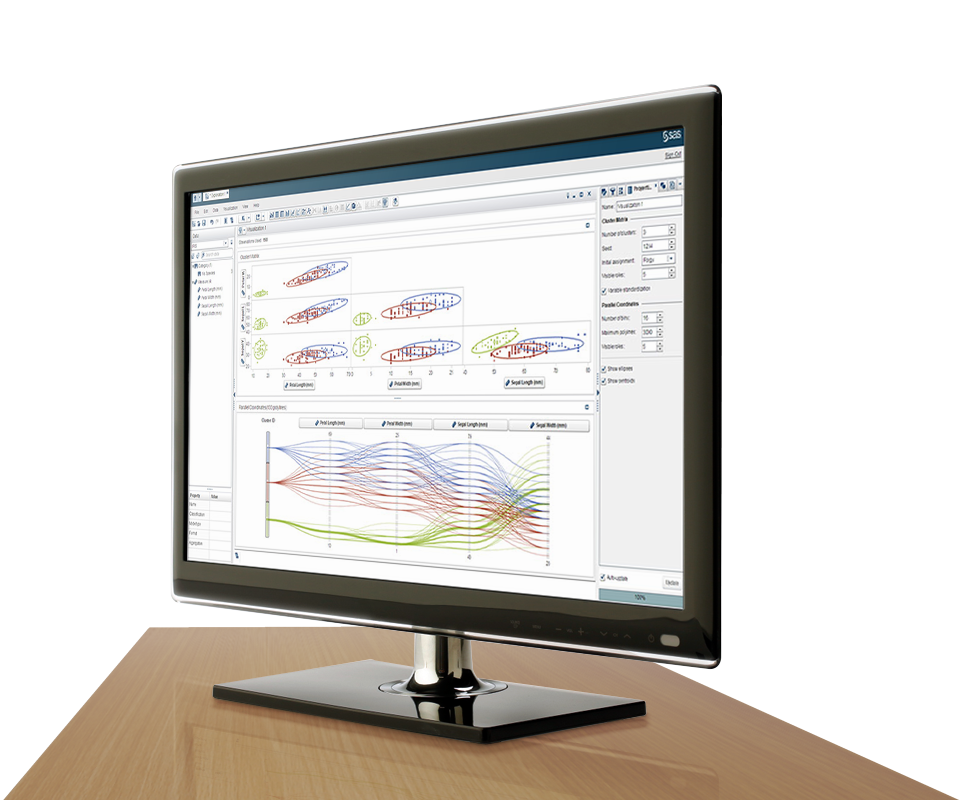
- An interactive data exploration and modeling environment. Quickly identify predictive drivers and interactively discover outliers across multiple variables with . Then create powerful descriptive and predictive models with a simple drag-and-drop interface.
- Descriptive modeling. Visually explore and evaluate segments for further analysis using k-means clustering, scatter plots and detailed summary statistics.
- Predictive modeling. Build predictive models using techniques such as linear regression, generalized linear modeling, logistic regression and classification trees.
- Dynamic group-by processing. Concurrently build models and process results for each group or segment without having to sort or index data each time.
Más información sobre este producto consulte en: http://www.sas.com/en_si/software/analytics/visual-statistics.html


